
The phrase “lies, damned lies, and statistics” popularised by Mark Twain, highlights the persuasive power of statistics and the potential for them to be used to bolster weak arguments.
Blair Robinson, the “tech-nerdy” Co-Founder of Real Estate Ai said, “Statistics can be manipulated or misinterpreted to support a particular viewpoint, making them a powerful tool for persuasion. It’s important to critically evaluate statistics to avoid being misled.”
This article helps you better understand your digital marketing statistics and avoid the pitfalls of deceptive or misleading data. Below is a real example of a SocialMAX campaign report from the REai platform. We’ll explain what each of the metrics mean in a way that you’ll understand.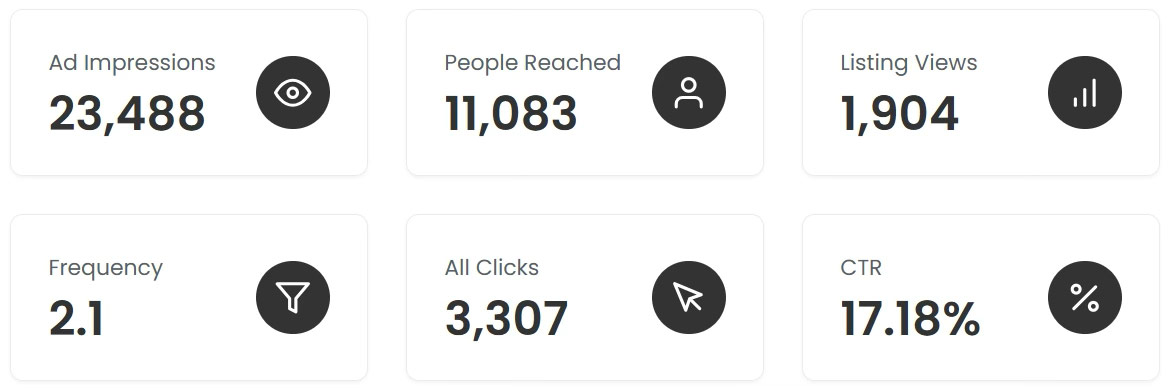
Ad Impressions
The total number of times your social media ad is displayed on a social media platform, even if the same person sees it multiple times.
Example above: 23,488
People Reached
The number of people who have seen your social media ad at least once.
Example above: 11,083
Frequency
The average number of times individual people see your social media ad
Ad Impressions / Reach = Frequency
Example above: 23,488 Ad Impressions / 11,083 People = 2.1 Frequency
All Clicks
The number of times people click on your social media ad. Clicks include call-to-action clicks, clicks on images, hashtags, like, comment and share buttons, etc
Example above: 3,307
Click-Through-Rate
The percentage of Ad Impressions that resulted in a click on the social media ad
(All Clicks / Ad Impressions) x 100 = Click-Through-Rate
Example above: (3,307 Clicks / 23,488 Impressions) x 100 = 14.07%
Listing Views
The number of times people click on your social media ad and land on the property details page on your website.
Example above: 1904
Engagement Rate
The percentage of people who clicked on your social media ad after seeing it and went through to view the property details page on your website.
(Listing Views / People) x 100 = Engagement Rate
Example above: (1904 Listing Views / 11,083 People) x 100 = 17.18%
Watch out for this trick!
The “lies, damned lies and statistics” deception is alive and well in digital marketing today. The digital marketing industry has a misleading definition of what click-through-rate is and what it means for your business.
Click-through rate is often defined as the percentage of “people” who clicked on your ad after seeing it and then show the calculation as (Total Clicks / Total Impressions) X 100. As you can see from the definitions above the number of people is different to the number of impressions. You can’t sell a house to an Ad Impression.
Additionally, clicks is not a great measure of engagement. We believe that our engagement rate statistic is a much better measure of performance. You want to maximise the number of people that see your social media ad and you want to maximise the number of people that click through to the property details page on your website, not just click around on the social media ad. What’s worse is we’ve seen some digital marketing providers pretending that “all clicks” are click-throughs to the property details page on the website.
How we’re different!
We only show the Click-Through-Rate on our reports so that you can compare apples with apples. We focus on the engagement rate statistic. This allows you to understand how many people are really interested enough to click through and have a good look at the property on your website. They are not just window shopping on social media, they are genuinely interested.
When you buy social media campaigns from a digital marketing company you are not just paying for people to see your social media ad (Ad Impressions). What you are really paying for is for someone to provide you with the technology and the know-how to maximise the number of the right people that see your property in their social media feeds, click-through-to the property details page on your website and turn up at an open-for-inspection.
What can you do about it?
First of all, knowledge is power. If you’re running digital marketing campaigns today go back to your digital marketing provider and check your performance reports. Check to see how they measure the performance of what you paid for, challenge them to show you Listing Page Views and engagement and compare your performance against the example case study in this article.